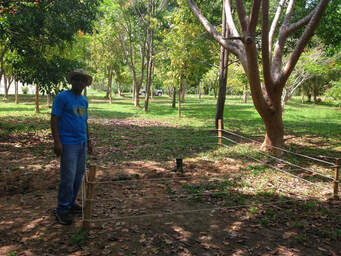
 From the Conversation: Dr Endawoke Yizengaw next to a magnetometer installation that records changes in the magnetic field at that spot in Phuket, Thailand. Endawoke Yizengaw, CC BY-ND. The original publication of this photo can be found at https://theconversation.com/damaging-electric-currents-in-space-affect-earths-equatorial-region-not-just-the-poles-45073
 The paper we are going to talk about today, "Interplanetary shocks and the resulting geomagnetically induced currents at the equator" is perhaps one of my favorites... not that I have favorites, I love all my papers equally... but if I had any favorites, this would be one of them. So what made this paper special? Part of it was being able to work with good friends on it. It is always a pleasure to be able to work with friends, especially when you know the work you are doing will be useful to others. And that's another reason why this paper is special. Often the work I do is more than a few steps removed from being able to be applied to our everyday lives. This project is much closer to helping others.
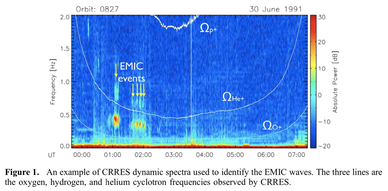
So what did we look at? We looked at how space weather can impact long pipes or wires in the ground and on the surface of the Earth, or well, a proxy for that. The pipes and wires may be power grids, oil or water pipe lines, or telephone or telegraph wires. It was often thought that this type of space weather effect was only important for higher latitudes around the poles. However, in this paper we showed that it can also be important around the magnetic equator. This region during the day has what is called the electrojet which can enhance the space weather impact on the power grids which sit underneath it. A model of the equatorial electrojet can be seen below.
So what did we look at? We looked at how space weather can impact long pipes or wires in the ground and on the surface of the Earth, or well, a proxy for that. The pipes and wires may be power grids, oil or water pipe lines, or telephone or telegraph wires. It was often thought that this type of space weather effect was only important for higher latitudes around the poles. However, in this paper we showed that it can also be important around the magnetic equator. This region during the day has what is called the electrojet which can enhance the space weather impact on the power grids which sit underneath it. A model of the equatorial electrojet can be seen below.
Modeled location of the equatorial electrojet from the viewpoint of a satellite sitting at about 10:00 am local time (Alken and Maus, 2007). From The Conversation article "Damaging electric currents in space affect Earth’s equatorial region, not just the poles"
Often the change in the local magnetic field strength is used to determine how big of an impact space weather will have. We looked at what the impact was under the equatorial electrojet compared to just outside it. We found that this impact was just as large as in the polar regions. We often like to use global indices or proxies, but this helped lead us to the idea that more local data. For instance, knowing the average temperature on Earth is nice and a useful proxy for some studies, but it isn't going to help you if you are trying to decide how many layers of clothes to put on in the morning.

 RSS Feed
